Media Kit
Newsletter, social, and video for Alameda brands.
Alameda's local newsletter and social channel, reaching the island's most engaged residents every week.
Audience snapshot
The Alameda Pulse by the numbers.
Instagram audience
Straight from Instagram Insights, trailing 90 days, against a follower count current as of August 4, 2026.
Age and gender
Instagram runs younger than the newsletter, and the two together cover the island end to end. The biggest single block is 35 to 44: working parents in their prime spending years. Pair a Reel with a newsletter placement and you reach both halves of Alameda in the same week.
Where followers live
Every one of the top five follower cities is in the Bay Area, and 98% of followers are in the United States. Alameda alone is roughly 8,800 followers, more than a quarter of the account. Add Oakland and you are at 42%, which is the bridge-and-tube crowd that already drives across for dinner.
When followers are online
Monday, Tuesday, and Wednesday, 6 to 9 PM Pacific. Sponsored posts and Reels go out inside that window so your placement lands when the island is actually looking.
Methodology: Age, gender, location, and activity windows are taken from Instagram Insights for @thealamedapulse covering the trailing 90 days; values are Meta estimates and percentages are rounded. Follower counts by city are calculated from those percentages against a total of 34,400 followers as of August 4, 2026. Newsletter figures come from Beehiiv as of August 4, 2026 and are reported separately above.
Ways to partner
However you want to reach the island, there's a fit.
Local businesses and services
Introduce your shop, studio, or service to the island. A newsletter feature or social post puts you in front of 10,224 weekly subscribers and 34,000 Instagram followers, with Alameda the largest single market on both.
Restaurants and food
Alameda loves to eat local. Our Eats coverage and Reels drive real foot traffic, reaching an Instagram following that is 81% age 25 to 54 and concentrated in Alameda and Oakland, plus a newsletter audience that skews 45+ and lives here.
Events, launches, and real estate
Opening a location, hosting an event, or featuring a listing? On-location video plus social posts introduce it to the neighborhood, backed by 1M+ monthly Instagram views.
What your placement looks like
Click any format below to open it up and see exactly what you get, where it sits, and what it has done for other businesses. Click any image to enlarge it.
▸ Newsletter top placement Your logo and graphic above the fold, before a word of editorial Click to see an example → $415 single
Click to enlarge
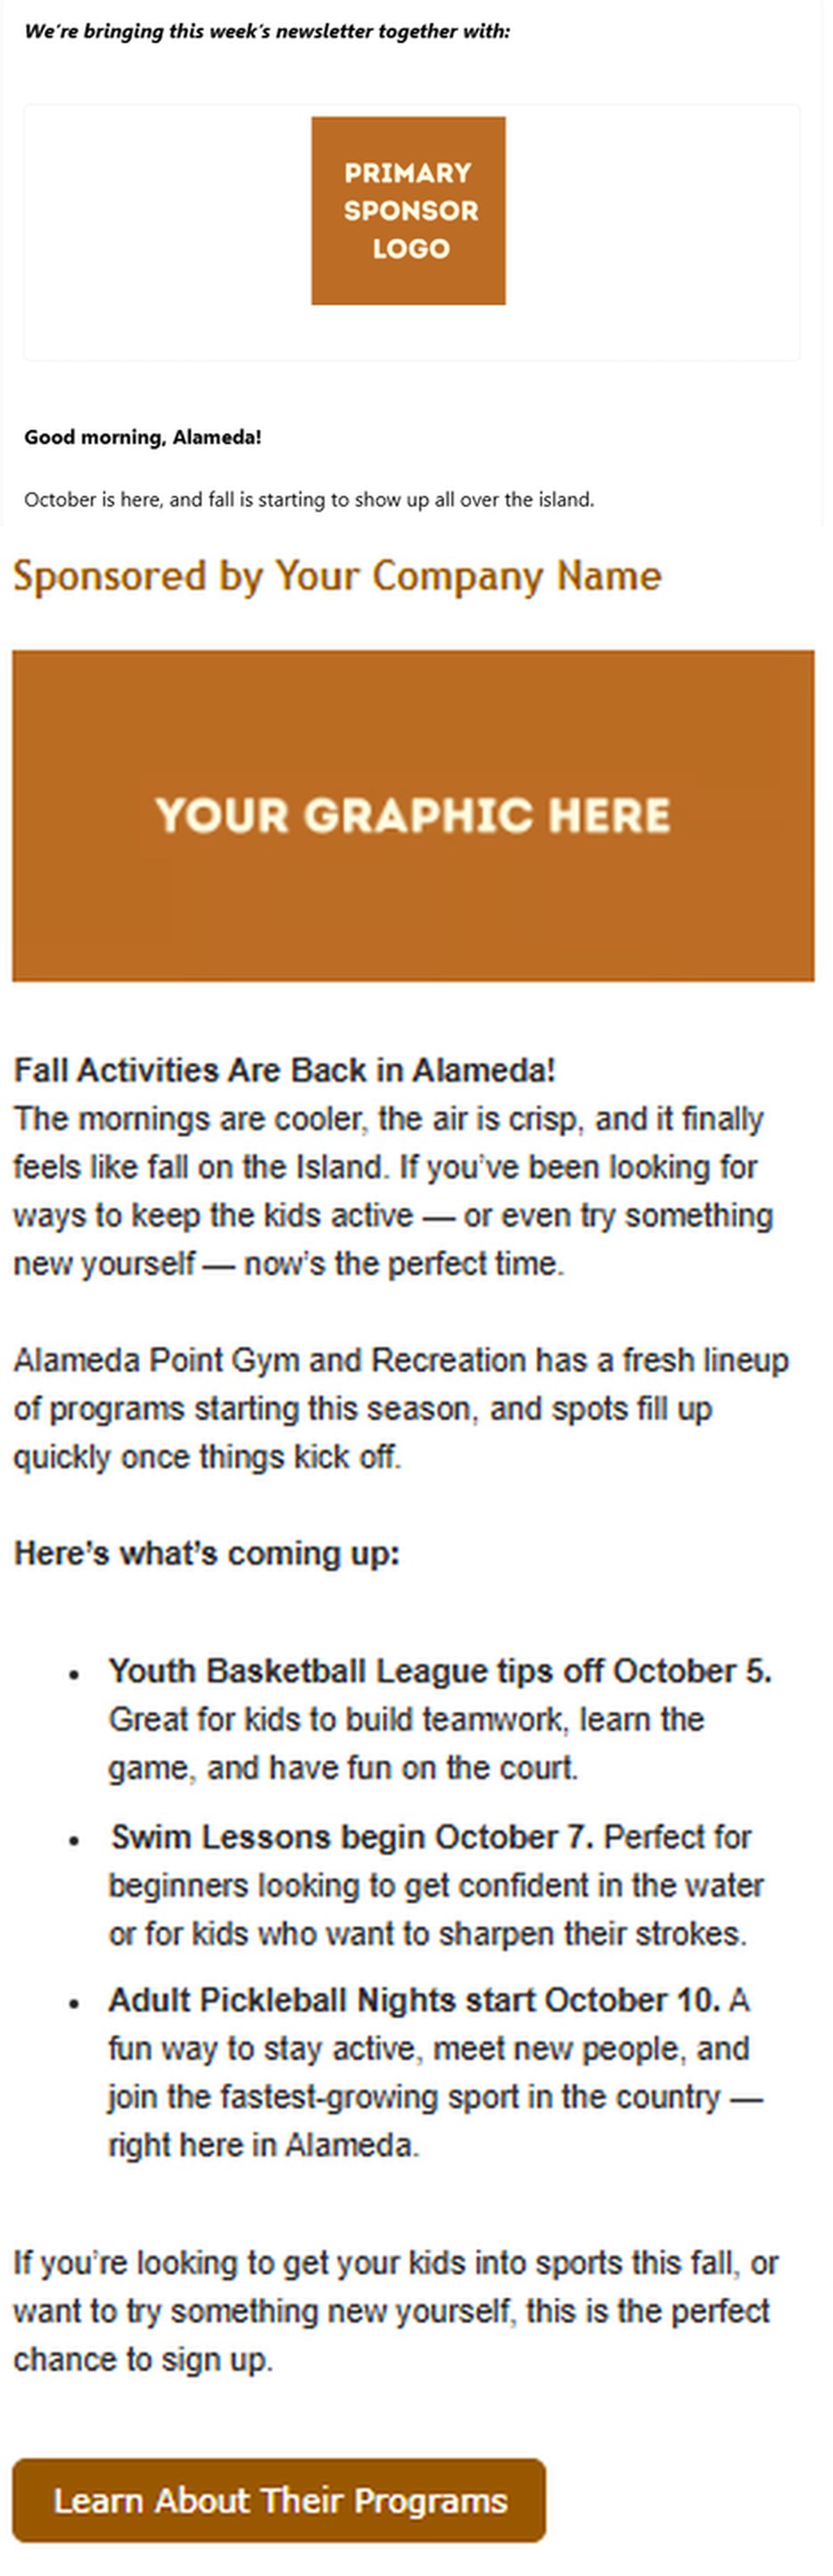
Layout mockup showing the real placement structure and proportions. Not a screenshot of a live send.
▸ Instagram and TikTok post A Reel we shoot, edit, and publish to the Pulse Click to see an example → $700 single
The range we shoot in
Four recent Reels from the Pulse. Same format every time: we show up, film it, and cut it into something people actually watch.
Click to enlarge


▸ Banner ad A single image slot inside the newsletter, booked by the quarter Click to see an example → From $1,500 / quarter
Click to enlarge

▸ Houses on the Market A standing slot in the newsletter's real estate section, for agents and brokerages Click to see an example → From $150 / week
Rates
The longer you hold the slot, the less each week costs.
| Reservation | Per week | Total | You save |
|---|---|---|---|
| 1 week | $150 | $150 | — |
| 4 weeks | $135 | $540 | 10% |
| 3 months (13 weeks) | $125 | $1,625 | 17% |
| 6 months (26 weeks) | $115 | $2,990 | 23% |
| 1 year (52 weeks) | $105 | $5,460 | 30% |
Want two placements? Reserve two at once and take 10% off the total. Properties in each placement can be changed or edited every week.
Click to enlarge

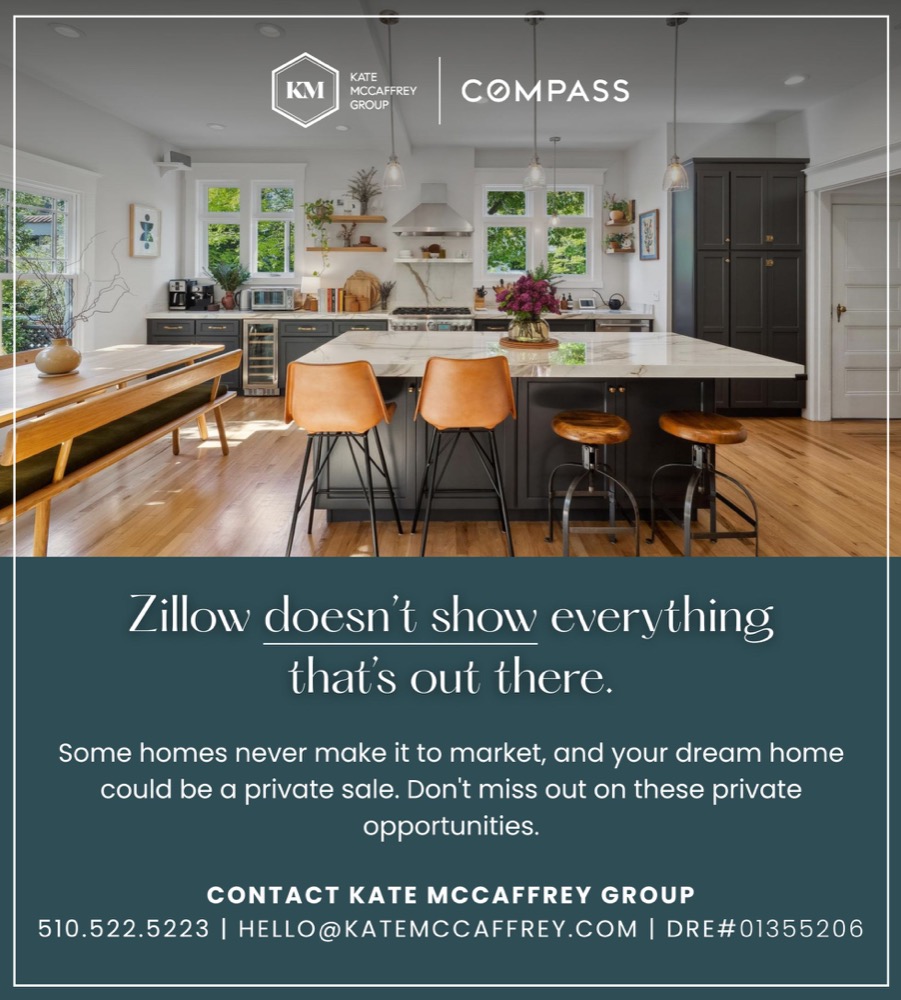
Kate McCaffrey Group has held the top Houses on the Market slot since February. Across 23 issues from February 12 to July 16, 2026, the placement sent more than 1,200 verified clicks to her listings from 1,160 unique readers, and 1235 Hawthorne, the ad above, was the best performer of the 21 properties featured.
See the full performance report →Pricing
Mix and match, or build a custom package around your goals and budget.
Influencer and creative posts
Newsletter sponsorship
Events in the newsletter
Houses on the Market
| Reservation | Per week | Total | You save |
|---|---|---|---|
| 1 week | $150 | $150 | — |
| 4 weeks | $135 | $540 | 10% |
| 3 months (13 weeks) | $125 | $1,625 | 17% |
| 6 months (26 weeks) | $115 | $2,990 | 23% |
| 1 year (52 weeks) | $105 | $5,460 | 30% |
Want two placements? Reserve two at once and take 10% off the total.
Banner ad
Video
Have a specific goal in mind?
Tell us what you're trying to reach and your budget, and we'll build a package that mixes newsletter, social, and video to fit.